Home
Portfolio
Careers
Company
Blog
Contact

Darkhorse Analytics | Edmonton, AB

Home
Portfolio
Careers
Company
Blog
Contact


13) Parallel Life Stories in Quebec

14) Brexit Voting like Cells

Maps

15) Soccer Stadium Sound Visualization

16) Contour Lines of Mountain in Hawaii

17) Carrot Map

18) Mountains of Light

19) Organic train “cells”

20) Asteroids Map

21) Opportunity Atlas

Photo and Video with Visualizations

22) Coronavirus Jobs lost

23) Pollution Inequality

24) Data about Health

25) Empty streets and buildings

1) Here is Today

2) Parler Capitol Videos

“Boring” Static Visualizations

3) Landscape Line Charts

4) Annual Report of the ERGO Hestia Group

5) How does COVID Compare to a bad winter

6) Drowning in Plastic

(Bonus) Warming Stripes

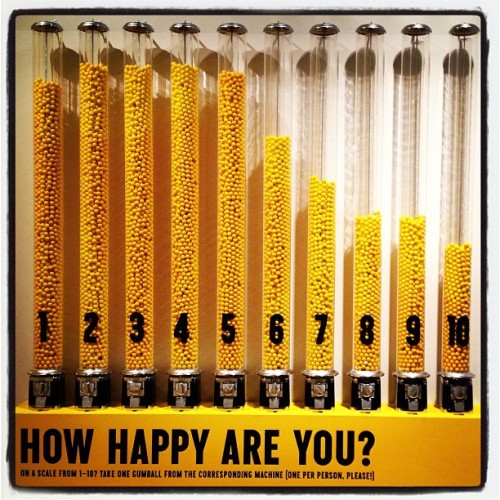
Physical Visualizations

7) Temperature Dress

8) Anatomical Edutainer

9) Happiness Exhibit

10) Playdoh Viz

11) Visualized Receipts

Story/ScrollyTelling

12) Going Gray

Other Visualizations

27) Breakdown of Gun Deaths

28) Rape Clearance

29) Rape in India

Extra) Coffins and Ambulance for COVID deaths

30) 100k COVID Deaths

Using Beauty

26a) Paper Angels

26b) Flowers

26c) Gun Deaths and Stolen Years

Back to Top
1-800-261-1832