Blog

Blog
We combined storytelling, 3D mapping, and data about the hundreds of neighbourhoods in Edmonton to create “This is Edmonton”.
Static data and charts don’t always have to be boring. We’ve put together a list of the Top 5 physical visualizations we’ve come across.
Using physical objects to display data and create visualizations may seem counterintuitive, but doing so can be incredibly effective and engaging. We’ve put together a list of the Top 5 physical visualizations we’ve come across.
Have you ever wondered if there was a better way to visualize your data? To make it more engaging, more visually impressive, or clearer to your audience? We’ve put together a list of the Top 5 maps we’ve come across.
The Paradox of Brilliance
It seems that the amount of intelligence needed to understand an idea is inversely proportional to its brilliance. My first conjecture: great ideas are grokkable, marginal ideas are not.
In this second part of the series, we explore how to be more effective in your visualizations. In this context, we defined effectiveness as a combination of clarity and engagement.
This is part one of a two-part series on building effective visualizations. In this post, we take a shallow dive into evaluating existing visualizations. In the next post, we’ll dive a little deeper as we explore techniques on how to improve them.
In visualization we have a vehicle capable of more than just communicating numbers.
Many organizations have begun to recognize the benefit of using analytics to support decision-making. At least in the abstract. But how to get the capability is not so clear.
Imagine your analytics dream team. Who would you hire, and what would their roles be?
A few years ago we worked with the Alberta Government on a tool that would make Fish Consumption Advisories more accessible to the general public. And after working its way through the government’s approvals process that tool is finally here.
If you aspire to be a data scientist, you’re really aspiring to be a data wrangler. You see, 80% of your working hours will be spent wrangling the data. That’s on average. On some projects, you will spend more than 100% of your “working” hours with your lasso. I hope you enjoy that sort of thing.
If you've got a large table with lots of rows, you might get fat. We think that's a good thing.
If you’ve tried to visualize your data with a map, you know how time-consuming it can be. It shouldn’t take so long or be so difficult, so we built MapInSeconds.com, which takes your data and generates a map - in seconds.
Visualization is not a straight path from vision to reality. It is full of twists and turns, rabbit trails and road blocks, foul-ups and failures. Let's walk through one visualization's twisted path.
Let's have a look at the many different methods for displaying distributions. We'll take one data set and display its distribution 16 different ways.
How many times has this happened to you: You get to the end of a gruelling analytics project and the decision maker doesn't listen?
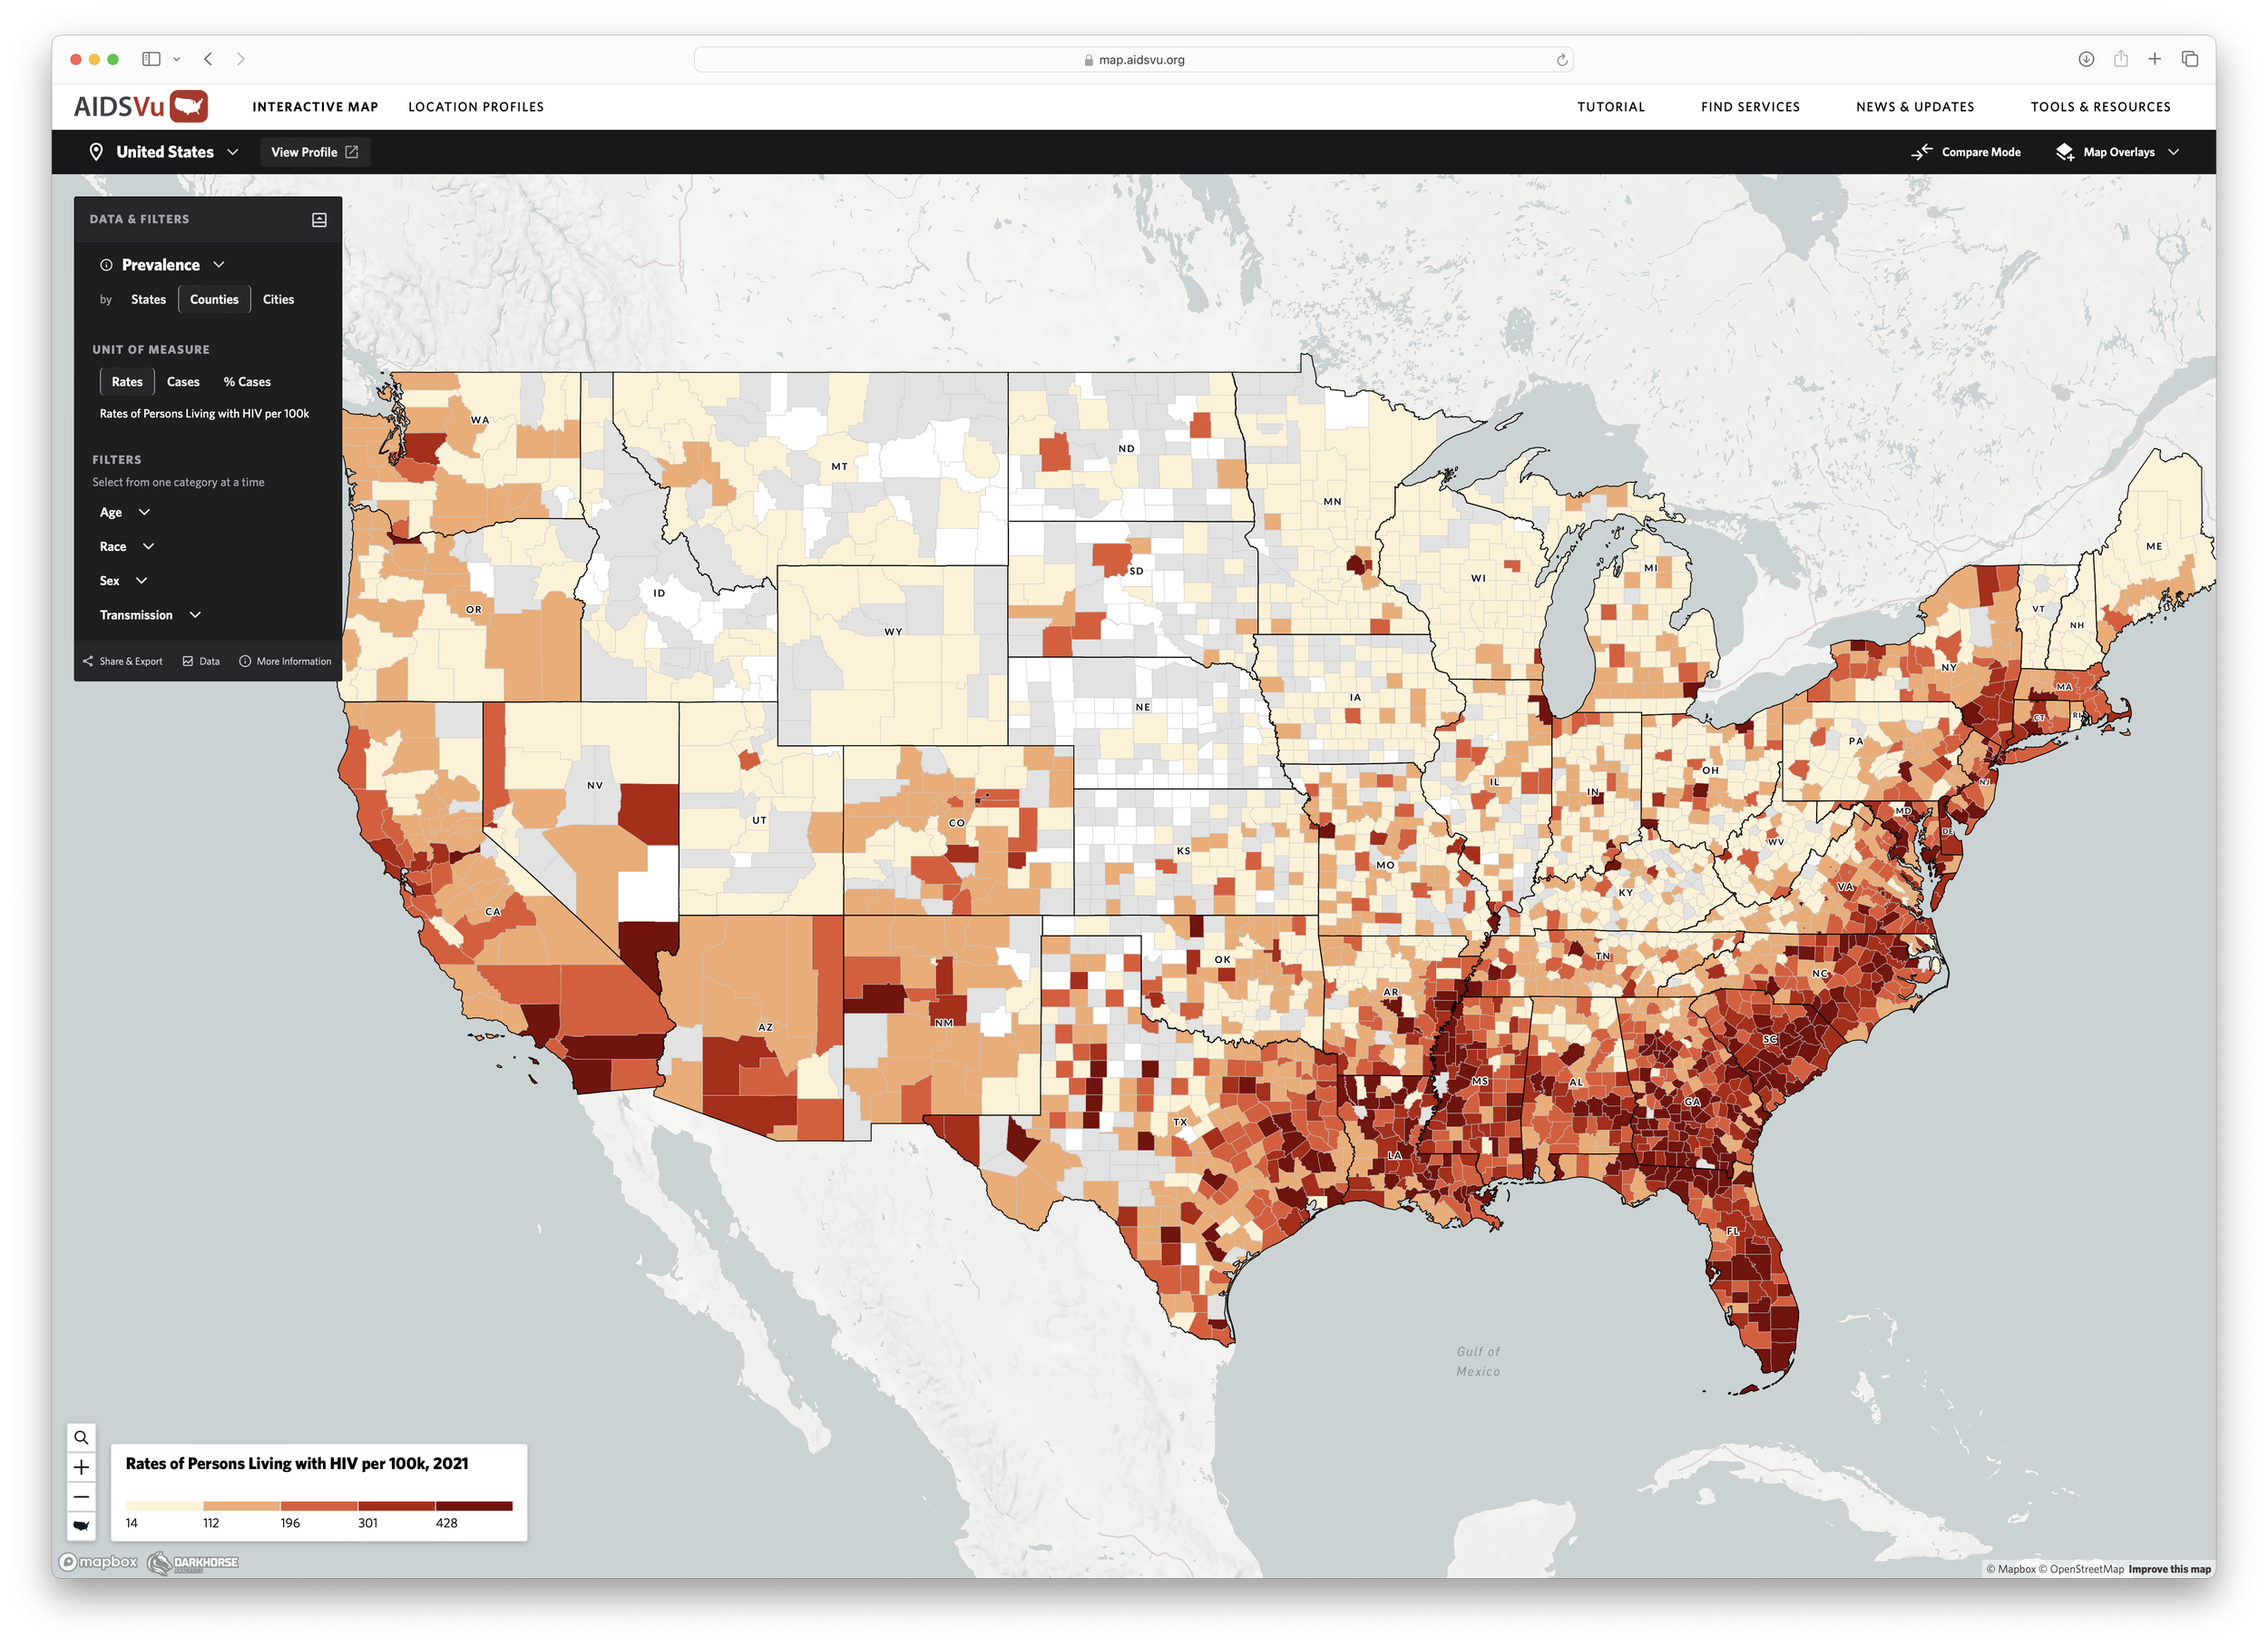
In this new installment of our Data Looks Better Naked series, we take on maps. More specifically, the choropleth map.
An analytics project is really three projects: a change management project stacked on top of a software development project stacked on top of a research project. So, how does one prevent the whole thing from collapsing under its own weight?
Our entry into the Apps for Alberta competition takes a look at high school grades across the province.
Have you met the pie chart’s evil cousin: the radar chart. It may not be as ubiquitous as the pie, but it can be more nefarious.
You’ve assembled a team and they’re ready to transform your organization into a data-driven decision-making juggernaut. But where should they start? How do you coordinate this team so they’ll actually be effective?
Don’t be afraid to make your charts smaller to communicate a bigger, more complete message.
The next instalment in our Data Looks Better Naked series takes on the dreaded pie chart.