Home
Portfolio
Careers
Company
Blog
Contact

Darkhorse Analytics | Edmonton, AB

Home
Portfolio
Careers
Company
Blog
Contact
Joey Cherdarchuk
April 24, 2012
Visualization

Payroll and Playoffs

Joey Cherdarchuk
April 24, 2012
Visualization
screenshot.165

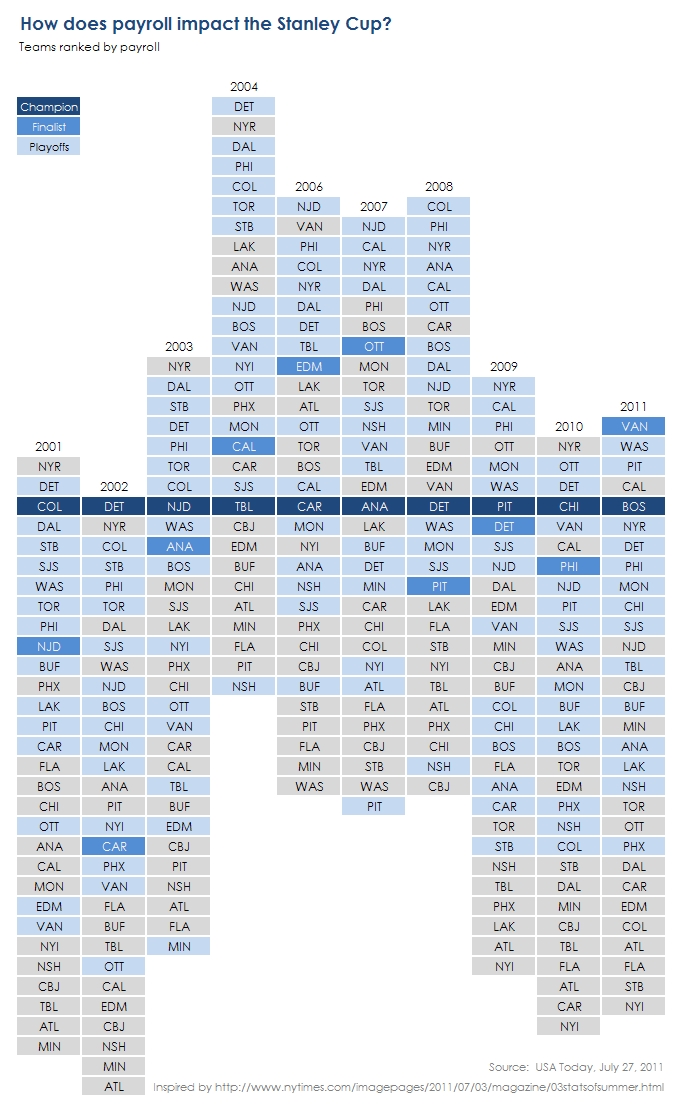
The NHL playoffs are underway and so some visual analytics are in order.  Inspired by Craig Robinson's graphic for Major League Baseball, we've put together a chart that looks at the relationship between payroll and Stanley Cup Championships over the past 10 seasons.

Newer PostSimple Bars vs Fanciful Circles
Older PostEven small data sets can yield insights


Popular

 
Featured
Darkhorse Analytics Partners with The University of Kansas to Unveil “The Care Board” Data Visualization
Lumina Foundation’s "Stronger Nation" Gets a Powerful New Data Experience
Darkhorse Analytics and Economic Policy Institute Unveil Redesigned Data Library

Visualizations

Back to Top
1-800-261-1832