Visualization
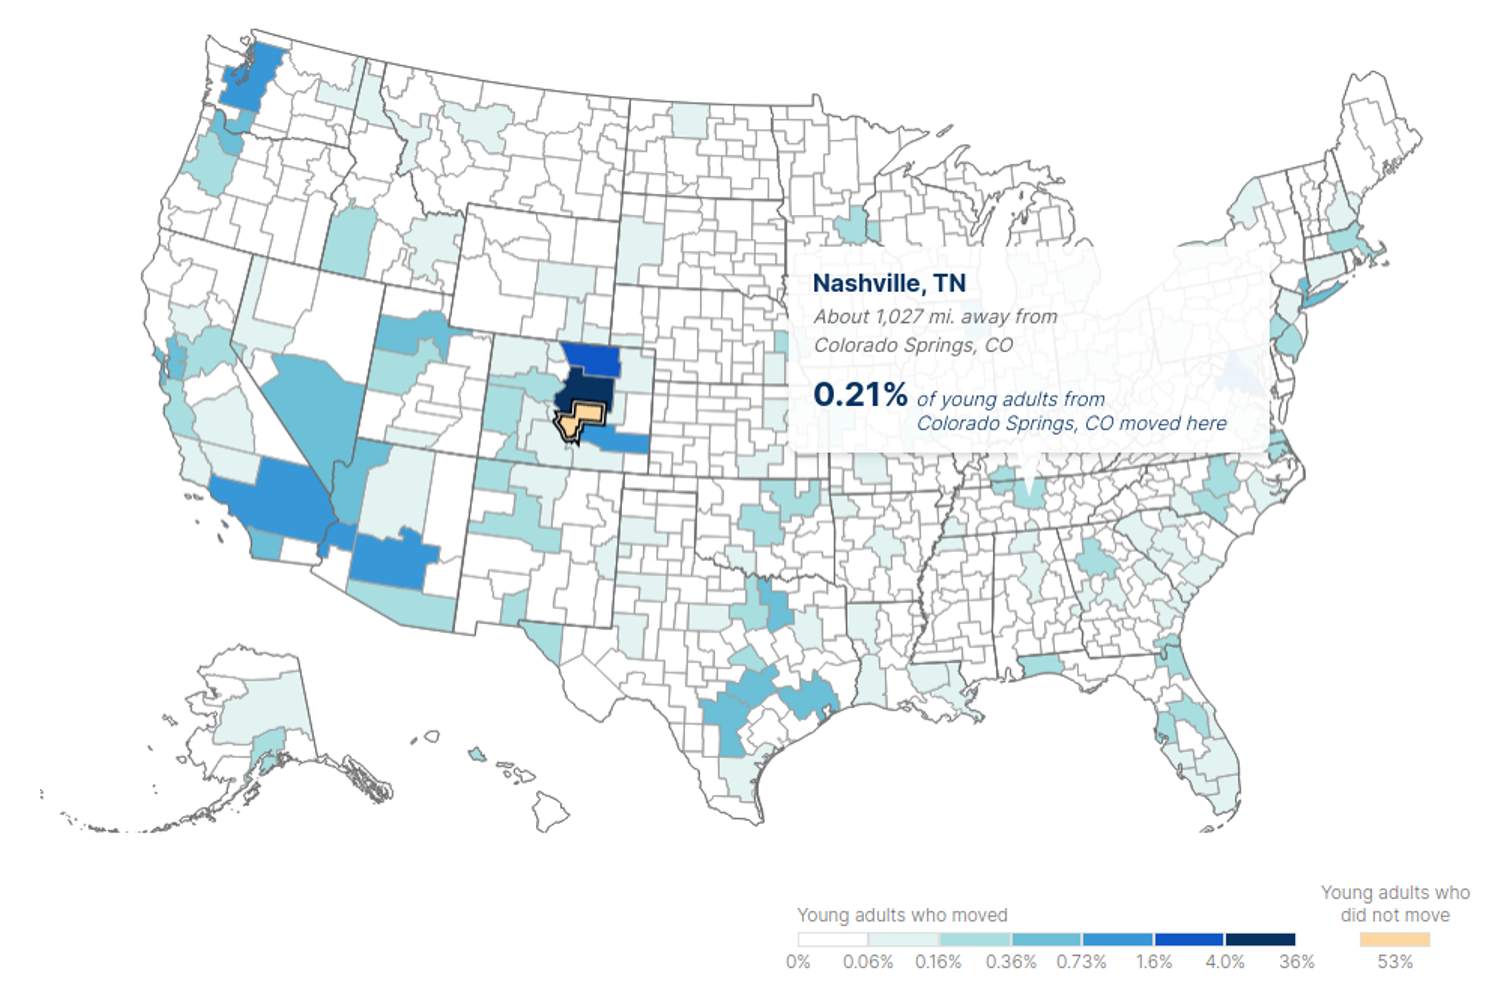
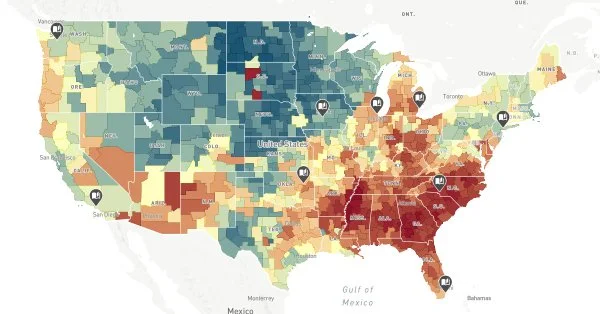
A detailed interactive application mapping the childhood roots of social mobility in the United States.
Visualization, Portfolio, Not-Mentioned-As-Yet
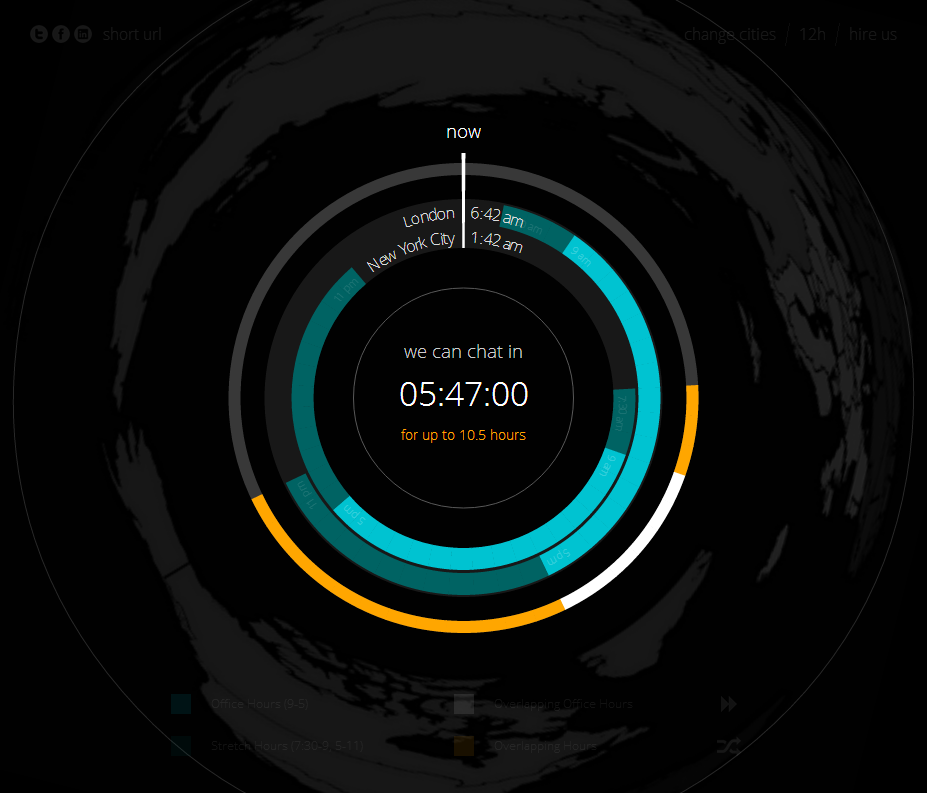
An animated visualization to create a sense of the life and movement that happens throughout a day in Manhattan.

Visualization, Portfolio
An interactive visualization exploring the impact metrics such as payroll and penalty minutes have on a team's performance.

Analytics, Portfolio, Not-Mentioned-As-Yet
An inventory planning and scheduling optimization to improve the efficiency and effectiveness of the harvest and transport plan for the pulp mill's logging operations.